Yes, we ship to 

Notebook Performance Comparisons

Tested Notebooks:
Sony Vaio VPC-Z128 * NEW!
ASUS G51JX-FHD-SZ071V
CPU
Intel i7-720QM 1.6GHz (Turbo boost to 2.8GHz) 6M, 8 Threads
| Pifast 10M Time (Single Core) | wPrime 32M Time (Multi Core) | Cinebench R10 Rendering (Multi Core) |
| 23.42s | 14.26s | 10035 |
| (Lower is better) | (Lower is better) | (Higher is better) |
HDD
Seagate ST9500420AS 500GB
| File Benchmark | File Benchmark | Random Access 4K |
| Maximum Read Speed | Maximum Write Speed | 53 IOPS |
| 85MB/s | 75MB/s | 0.210MB/s |
Graphics
nVidia GeForce GTS 360M
| 3D Mark 06 Score | Sub Score SM2.0 | Sub Score HDR/SM3.0 | Sub Score CPU |
| 8976 | 3655 | 3696 | 3175 |
| (Higher is better) |
Memory
8GB DDR3 1333MHz
| Read | Write | Copy | Latency |
| 14631MB/s | 12215MB/s | 13112MB/s | 55.5ns |
Thermal Control
Sensor Temperatures
| CPU | GPU | HDD | Mainboard | |
| Idle | 45c | 45c | 29c | N/A |
| Full | 72c | 65c | 32c | N/A |
Highlights
Full HD in a 15.6" screen
ASUS Extreme Turbo Mode overclocks CPU to 3.0GHz
Best value for money
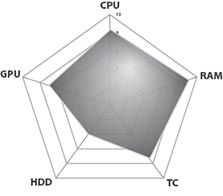
ASUS G73JH-TZ008X
CPU
Intel i7-720QM 1.6GHz (Turbo boost to 2.8GHz) 6M, 8 Threads
| Pifast 10M Time (Single Core) | wPrime 32M Time (Multi Core) | Cinebench R10 Rendering (Multi Core) |
| 23.06s | 14.512s | 10139 |
| (Lower is better) | (Lower is better) | (Higher is better) |
HDD
Seagate ST9500420AS 500GB
| File Benchmark | File Benchmark | Random Access 4K |
| Maximum Read Speed | Maximum Write Speed | 60 IOPS |
| 102MB/s | 88MB/s | 0.236MB/s |
Graphics
ATI Mobility Radeon HD 5870 (1GB)
| 3D Mark 06 Score | Sub Score SM2.0 | Sub Score HDR/SM3.0 | Sub Score CPU |
| 12348 | 4949 | 5691 | 2896 |
| (Higher is better) |
Memory
8GB DDR3 1333MHz (4x2GB)
| Read | Write | Copy | Latency |
| 13804MB/s | 11438MB/s | 12552MB/s | 44.1ns |
Thermal Control
Sensor Temperatures
| CPU | GPU | HDD | Mainboard | |
| Idle | 42c | 54c | 30c | N/A |
| Full | 72c | 76c | 30c | N/A |
Highlights
ASUS Turbo Mode can overclock CPU beyond 2.8GHz
Very good thermal control
Best performing single graphic card so far
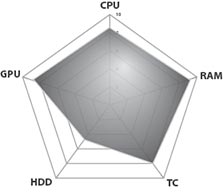
ASUS G73JW-TZ0039V
CPU
Intel i7-720QM 1.6GHz (Turbo boost to 2.8GHz) 6M, 8 Threads
| Pifast 10M Time (Single Core) | wPrime 32M Time (Multi Core) | Cinebench R10 Rendering (Multi Core) |
| 21.68s | 12.384s | 11541 |
| (Lower is better) | (Lower is better) | (Higher is better) |
HDD
Seagate ST9500420AS 500GB
| File Benchmark | File Benchmark | Random Access 4K |
| Maximum Read Speed | Maximum Write Speed | 55 IOPS |
| 105MB/s | 98MB/s | 0.218MB/s |
Graphics
ATI Mobility Radeon HD 5870 (1GB)
| 3D Mark 06 Score | Sub Score SM2.0 | Sub Score HDR/SM3.0 | Sub Score CPU |
| 12757 | 5445 | 5597 | 3570 |
| (Higher is better) |
Memory
8GB DDR3 1333MHz (4x2GB)
| Read | Write | Copy | Latency |
| 15088MB/s | 12422MB/s | 13787MB/s | 32.8ns |
Thermal Control
Sensor Temperatures
| CPU | GPU | HDD | Mainboard | |
| Idle | 40c | 37c | 31c | N/A |
| Full | 72c | 65c | 36c | N/A |
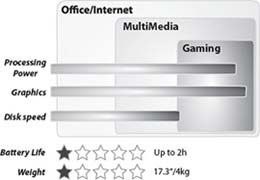
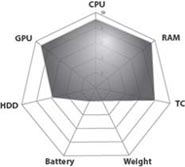
ASUS N71JQ-TY022X
CPU
Intel i7-720QM 1.6GHz (Turbo boost to 2.8GHz) 6M, 8 Threads
| Pifast 10M Time (Single Core) | wPrime 32M Time (Multi Core) | Cinebench R10 Rendering (Multi Core) |
| 23.70s | 15.055s | 9538 |
| (Lower is better) | (Lower is better) | (Higher is better) |
HDD
Western Digital WD6400BEVT-80A0RT 640GB
| File Benchmark | File Benchmark | Random Access 4K |
| Maximum Read Speed | Maximum Write Speed | 52 IOPS |
| 78MB/s | 78MB/s | 0.205MB/s |
Graphics
ATI Mobility Radeon HD 5730
| 3D Mark 06 Score | Sub Score SM2.0 | Sub Score HDR/SM3.0 | Sub Score CPU |
| 7985 | 2887 | 3583 | 2980 |
| (Higher is better) |
Memory
4GB DDR3 1333MHz
| Read | Write | Copy | Latency |
| 14188MB/s | 11509MB/s | 12626MB/s | 57.3ns |
Thermal Control
Sensor Temperatures
| CPU | GPU | HDD | Mainboard | |
| Idle | 52c | 51c | 29c | N/A |
| Full | 76c | 67c | 32c | N/A |
Highlights
High resolution 1600x900 screen
USB 3.0 port
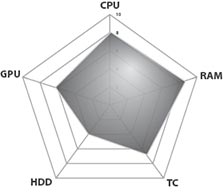
ASUS PL30JT-RO025X
CPU
Intel i5-520UM 1.06GHz (Turbo boost to 2.47GHz), 3M, 4 Threads
| Pifast 10M Time (Single Core) | wPrime 32M Time (Multi Core) | Cinebench R10 Rendering (Multi Core) |
| 28.59s | 26.317s | 5790 |
| (Lower is better) | (Lower is better) | (Higher is better) |
HDD
Seagate ST9500325AS 500GB
| File Benchmark | File Benchmark | Random Access 4K |
| Maximum Read Speed | Maximum Write Speed | 48 IOPS |
| 78MB/s | 72MB/s | 0.191MB/s |
Graphics
nVidia GeForce GT310M
| 3D Mark 06 Score | Sub Score SM2.0 | Sub Score HDR/SM3.0 | Sub Score CPU |
| 3369 | 1306 | 1242 | 2006 |
| (Higher is better) |
Memory
4GB DDR3 1066MHz (2x2GB)
| Read | Write | Copy | Latency |
| 7067MB/s | 6857MB/s | 7780MB/s | 98.7ns |
Thermal Control
Sensor Temperatures
| CPU | GPU | HDD | Mainboard | |
| Idle | 43c | 46c | 28c | N/A |
| Full | 70c | 65c | 29c | N/A |
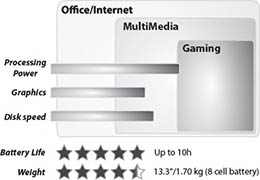
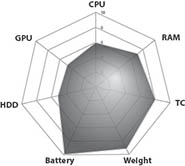
ASUS X52JB-SX014V
CPU
Intel Core i3-350M 2.26GHz, 3M
| Pifast 10M Time (Single Core) | wPrime 32M Time (Multi Core) | Cinebench R10 Rendering (Multi Core) |
| 28.34s | 21.217s | 6639 |
| (Lower is better) | (Lower is better) | (Higher is better) |
HDD
Seagate ST9500325AS 500GB
| File Benchmark | File Benchmark | Random Access 4K |
| Maximum Read Speed | Maximum Write Speed | 52 IOPS |
| 74MB/s | 70MB/s | 0.203MB/s |
Graphics
ATI Mobility Radeon HD 5145
| 3D Mark 06 Score | Sub Score SM2.0 | Sub Score HDR/SM3.0 | Sub Score CPU |
| 4097 | 1421 | 1690 | 2355 |
| (Higher is better) |
Memory
4GB DDR3 1066MHz
| Read | Write | Copy | Latency |
| 7446MB/s | 7234MB/s | 8744MB/s | 103.1ns |
Thermal Control
Sensor Temperatures
| CPU | GPU | HDD | Mainboard | |
| Idle | 32c | 40c | 30c | 27c |
| Full | 64c | 66c | 32c | 41c |

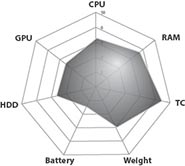
ASUS X52JK-SX087V
CPU
Intel i5-430M 2.26GHz (Turbo boost to 2.53GHz)
| Pifast 10M Time (Single Core) | wPrime 32M Time (Multi Core) | Cinebench R10 Rendering (Multi Core) |
| 26.01s | 19.019s | 7541 |
| (Lower is better) | (Lower is better) | (Higher is better) |
HDD
Seagate ST9500325AS 500GB
| File Benchmark | File Benchmark | Random Access 4K |
| Maximum Read Speed | Maximum Write Speed | 52 IOPS |
| 74MB/s | 70MB/s | 0.207MB/s |
Graphics
ATI Mobility Radeon HD 5145
| 3D Mark 06 Score | Sub Score SM2.0 | Sub Score HDR/SM3.0 | Sub Score CPU |
| 4169 | 1439 | 1702 | 2563 |
| (Higher is better) |
Memory
4GB DDR3 1066MHz
| Read | Write | Copy | Latency |
| 7528MB/s | 7468MB/s | 7779MB/s | 102.2ns |
Thermal Control
Sensor Temperatures
| CPU | GPU | HDD | Mainboard | |
| Idle | 40c | 41c | 29c | N/A |
| Full | 72c | 69c | 31c | N/A |
Highlights
Surprising graphics performance
Best value for money
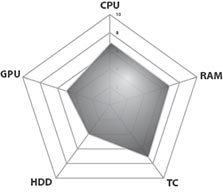
HP Compaq Presario CQ42-136TU
CPU
Intel Celeron T3100 1.9GHz
| Pifast 10M Time (Single Core) | wPrime 32M Time (Multi Core) | Cinebench R10 Rendering (Multi Core) |
| 40.95s | 40.593s | 3691 |
| (Lower is better) | (Lower is better) | (Higher is better) |
HDD
Seagate ST9250410AS 250GB 7200rpm
| File Benchmark | File Benchmark | Random Access 4K |
| Maximum Read Speed | Maximum Write Speed | 55 IOPS |
| 98MB/s | 83MB/s | 0.215MB/s |
Graphics
Intel Graphics Media Accelerator 4500M
| 3D Mark 06 Score | Sub Score SM2.0 | Sub Score HDR/SM3.0 | Sub Score CPU |
| 728 | 224 | 285 | 1566 |
| (Higher is better) |
Memory
2GB DDR3 800MHz
| Read | Write | Copy | Latency |
| 5333MB/s | 4095MB/s | 4069MB/s | 84.4ns |
Thermal Control
Sensor Temperatures
| CPU | GPU | HDD | Mainboard | |
| Idle | 26c | N/A | 26c | N/A |
| Full | 56c | N/A | 31c | N/A |
Highlights
Fast 7200rpm hard drive
New Celeron processor doesn't generate much heat

HP Compaq Presario CQ62-115TX
CPU
Intel Core i5-430M 2.26GHz (Turbo boost to 2.53GHz)
| Pifast 10M Time (Single Core) | wPrime 32M Time (Multi Core) | Cinebench R10 Rendering (Multi Core) |
| 26.37s | 19.00s | 6379 |
| (Lower is better) | (Lower is better) | (Higher is better) |
HDD
Seagate ST9500420AS 500GB 7200rpm
| File Benchmark | File Benchmark | Random Access 4K |
| Maximum Read Speed | Maximum Write Speed | 55 IOPS |
| 98MB/s | 85MB/s | 0.217MB/s |
Graphics
ATI Mobility Radeon HD 5430
| 3D Mark 06 Score | Sub Score SM2.0 | Sub Score HDR/SM3.0 | Sub Score CPU |
| 3585 | 1184 | 1472 | 2625 |
| (Higher is better) |
Memory
8GB DDR3 1066MHz
| Read | Write | Copy | Latency |
| 7558MB/s | 7471MB/s | 8836MB/s | 101.0ns |
Thermal Control
Sensor Temperatures
| CPU | GPU | HDD | Mainboard | |
| Idle | 35c | 36c | 32c | N/A |
| Full | 73c | 66c | 35c | N/A |
Highlights
7200rpm hard drive
Excellent value for money
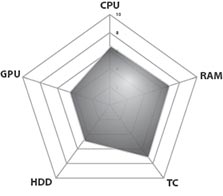
HP Pavilion dm3-1021TX
CPU
Intel Core 2 Duo SU7300 ULV 1.3GHz
| Pifast 10M Time (Single Core) | wPrime 32M Time (Multi Core) | Cinebench R10 Rendering (Multi Core) |
| 54.01s | 59.218s | 2665 |
| (Lower is better) | (Lower is better) | (Higher is better) |
HDD
Hitachi HTS725032A9A 320GB 7200rpm
| File Benchmark | File Benchmark | Random Access 4K |
| Maximum Read Speed | Maximum Write Speed | 48 IOPS |
| 88MB/s | 82MB/s | 0.189MB/s |
Graphics
nVidia GeForce G105M
| 3D Mark 06 Score | Sub Score SM2.0 | Sub Score HDR/SM3.0 | Sub Score CPU |
| 2772 | 1107 | 1100 | 1138 |
| (Higher is better) |
Memory
4GB DDR3 800MHz
| Read | Write | Copy | Latency |
| 5252MB/s | 4215MB/s | 3993MB/s | 102.2ns |
Thermal Control
Sensor Temperatures
| CPU | GPU | HDD | Mainboard | |
| Idle | 41c | 46c | 32c | N/A |
| Full | 56c | 57c | 34c | N/A |
Highlights
7200rpm hard drive
ULV platform = long battery life
Aluminium body
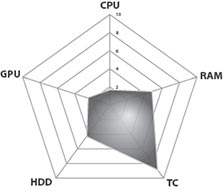
HP Pavilion dv6-3032TX
CPU
Intel i7-720QM 1.6GHz (Turbo boost to 2.8GHz), 6M, 8 Threads
| Pifast 10M Time (Single Core) | wPrime 32M Time (Multi Core) | Cinebench R10 Rendering (Multi Core) |
| 24.15s | 14.701s | 10192 |
| (Lower is better) | (Lower is better) | (Higher is better) |
HDD
Samsung HM641JI 640GB
| File Benchmark | File Benchmark | Random Access 4K |
| Maximum Read Speed | Maximum Write Speed | 55 IOPS |
| 80MB/s | 72MB/s | 0.216MB/s |
Graphics
ATI Mobility Radeon HD 5650 (1GB)
| 3D Mark 06 Score | Sub Score SM2.0 | Sub Score HDR/SM3.0 | Sub Score CPU |
| 7663 | 2715 | 3381 | 3166 |
| (Higher is better) |
Memory
6GB DDR3 1333MHz (4GB+2GB)
| Read | Write | Copy | Latency |
| 13897MB/s | 11500MB/s | 12431MB/s | 57.4ns |
Thermal Control
Sensor Temperatures
| CPU | GPU | HDD | Mainboard | |
| Idle | 42c | N/A | 28c | N/A |
| Full | 78c | N/A | 29c | N/A |
Highlights
Very good thermal control
Carved aluminium body
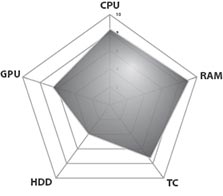
Lenovo IdeaPad S10-3
CPU
Intel Atom N455 1.66GHz
| Pifast 10M Time (Single Core) | wPrime 32M Time (Multi Core) | Cinebench R10 Rendering (Multi Core) |
| 194.36s | 116.454s | 865 |
| (Lower is better) | (Lower is better) | (Higher is better) |
HDD
Western Digital 250GB
| File Benchmark | File Benchmark | Random Access 4K |
| Maximum Read Speed | Maximum Write Speed | 42 IOPS |
| 52MB/s | 48MB/s | 0.168MB/s |
Graphics
Intel GMA 3150
| 3D Mark 06 Score | Sub Score SM2.0 | Sub Score HDR/SM3.0 | Sub Score CPU |
| 156 | 72 | N/A | 491 |
| (Higher is better) |
Memory
4GB DDR3 1066MHz
| Read | Write | Copy | Latency |
| 3382MB/s | 2953MB/s | 2126MB/s | 97.7ns |
Thermal Control
Sensor Temperatures
| CPU | GPU | HDD | Mainboard | |
| Idle | 32c | N/A | 27c | 35c |
| Full | 69c | N/A | 37c | 68c |
Lenovo G560 (0679-2KM)
CPU
Intel i3-330M 2.13GHz, 6M
| Pifast 10M Time (Single Core) | wPrime 32M Time (Multi Core) | Cinebench R10 Rendering (Multi Core) |
| 42.57s | 37.658s | 4211 |
| (Lower is better) | (Lower is better) | (Higher is better) |
HDD
Western Digital WD3200BEVT-24A23 320GB
| File Benchmark | File Benchmark | Random Access 4K |
| Maximum Read Speed | Maximum Write Speed | 49 IOPS |
| 55MB/s | 52MB/s | 0.192MB/s |
Graphics
Intel GMA HD (HM55 Express Chipset)
| 3D Mark 06 Score | Sub Score SM2.0 | Sub Score HDR/SM3.0 | Sub Score CPU |
| 1717 | 530 | 705 | 1870 |
| (Higher is better) |
Memory
4GB DDR3 1066MHz
| Read | Write | Copy | Latency |
| 7373MB/s | 7444MB/s | 8680MB/s | 103.5ns |
Thermal Control
Sensor Temperatures
| CPU | GPU | HDD | Mainboard | |
| Idle | 41c | N/A | 34c | N/A |
| Full | 60c | N/A | 40c | N/A |
Highlights
Good thermal control
Lenovo G560 (0679-43M)
CPU
Intel i3-350M 2.26GHz, 3MB
| Pifast 10M Time (Single Core) | wPrime 32M Time (Multi Core) | Cinebench R10 Rendering (Multi Core) |
| 28.52s | 20.983s | 7109 |
| (Lower is better) | (Lower is better) | (Higher is better) |
HDD
Western Digital WD5000BEVT 500GB
| File Benchmark | File Benchmark | Random Access 4K |
| Maximum Read Speed | Maximum Write Speed | 51 IOPS |
| 48MB/s | 46MB/s | 0.201MB/s |
Graphics
Intel GMA HD (HM55 Express Chipset)
| 3D Mark 06 Score | Sub Score SM2.0 | Sub Score HDR/SM3.0 | Sub Score CPU |
| 1734 | 527 | 706 | 2370 |
| (Higher is better) |
Memory
4GB DDR3 1066MHz
| Read | Write | Copy | Latency |
| 7385MB/s | 7087MB/s | 8609MB/s | 102.7ns |
Thermal Control
Sensor Temperatures
| CPU | GPU | HDD | Mainboard | |
| Idle | 39c | N/A | 37c | 39c |
| Full | 65c | N/A | 40c | 66c |

Lenovo G560 (0679-6DM)
CPU
Intel i5-450M 2.4GHz (Turbo 2.66GHz)
| Pifast 10M Time (Single Core) | wPrime 32M Time (Multi Core) | Cinebench R10 Rendering (Multi Core) |
| 24.52s | 18.408s | 7990 |
| (Lower is better) | (Lower is better) | (Higher is better) |
HDD
Western Digital WD5000BEVT 500GB
| File Benchmark | File Benchmark | Random Access 4K |
| Maximum Read Speed | Maximum Write Speed | 52 IOPS |
| 45MB/s | 44MB/s | 0.204MB/s |
Graphics
Intel GMA HD (HM55 Express Chipset)
| 3D Mark 06 Score | Sub Score SM2.0 | Sub Score HDR/SM3.0 | Sub Score CPU |
| 1380 | 415 | 552 | 2766 |
| (Higher is better) |
Memory
4GB DDR3 1066MHz
| Read | Write | Copy | Latency |
| 7405MB/s | 7073MB/s | 8673MB/s | 103.9ns |
Thermal Control
Sensor Temperatures
| CPU | GPU | HDD | Mainboard | |
| Idle | 27c | N/A | 33c | 26c |
| Full | 71c | N/A | 40c | 71c |
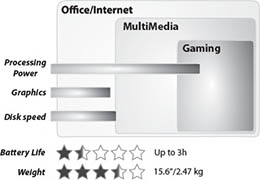
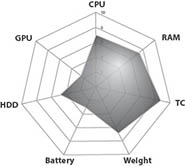
Lenovo G560 (0679-89M)
CPU
Intel i5-460M 2.53GHz (Turbo 2.8GHz)
| Pifast 10M Time (Single Core) | wPrime 32M Time (Multi Core) | Cinebench R10 Rendering (Multi Core) |
| 23.79s | 18.063s | 8377 |
| (Lower is better) | (Lower is better) | (Higher is better) |
HDD
Western Digital WD5000BEVT 500GB
| File Benchmark | File Benchmark | Random Access 4K |
| Maximum Read Speed | Maximum Write Speed | 52 IOPS |
| 45MB/s | 44MB/s | 0.205MB/s |
Graphics
Intel GMA HD (HM55 Express Chipset)
| 3D Mark 06 Score | Sub Score SM2.0 | Sub Score HDR/SM3.0 | Sub Score CPU |
| 1615 | 475 | 662 | 2852 |
| (Higher is better) |
Memory
4GB DDR3 1066MHz
| Read | Write | Copy | Latency |
| 7372MB/s | 6946MB/s | 7087MB/s | 103.3ns |
Thermal Control
Sensor Temperatures
| CPU | GPU | HDD | Mainboard | |
| Idle | 38c | N/A | 36c | 39c |
| Full | 71c | N/A | 42c | 71c |
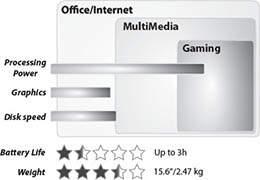

Lenovo ThinkPad Edge 13" (0196-3HM)
CPU
Intel Core 2 Duo ULV U7300 1.3GHz
| Pifast 10M Time (Single Core) | wPrime 32M Time (Multi Core) | Cinebench R10 Rendering (Multi Core) |
| 55.08s | 59.02s | 2670 |
| (Lower is better) | (Lower is better) | (Higher is better) |
HDD
Seagate ST9320325AS 320GB
| File Benchmark | File Benchmark | Random Access 4K |
| Maximum Read Speed | Maximum Write Speed | 50 IOPS |
| 65MB/s | 66MB/s | 0.196MB/s |
Graphics
Intel Graphics Media Accelerator
| 3D Mark 06 Score | Sub Score SM2.0 | Sub Score HDR/SM3.0 | Sub Score CPU |
| 788 | 250 | 308 | 1175 |
| (Higher is better) |
Memory
2GB DDR3 800MHz
| Read | Write | Copy | Latency |
| 5157MB/s | 4070MB/s | 3774MB/s | 104.7ns |
Thermal Control
Sensor Temperatures
| CPU | GPU | HDD | Mainboard | |
| Idle | 37c | N/A | 27c | N/A |
| Full | 52c | N/A | 28c | N/A |
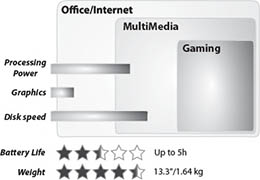
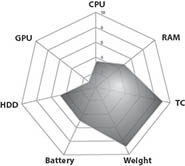
Sony Vaio VPC-Z128
CPU
Intel i7-720QM 1.6GHz (Turbo boost to 3.33GHz)
| Pifast 10M Time (Single Core) | wPrime 32M Time (Multi Core) | Cinebench R10 Rendering (Multi Core) |
| 20.37s | 16.304s | 9198 |
| (Lower is better) | (Lower is better) | (Higher is better) |
SSD
256GB Solid State Drive (RAID 0)
| File Benchmark | File Benchmark | Random Access 4K |
| Maximum Read Speed | Maximum Write Speed | 4207 IOPS |
| 450MB/s | 380MB/s | 16.434MB/s |
Graphics
nVidia GeForce GT330M
| 3D Mark 06 Score | Sub Score SM2.0 | Sub Score HDR/SM3.0 | Sub Score CPU |
| 5640 | 2241 | 2076 | 3034 |
| (Higher is better) |
Memory
8GB DDR3 1066MHz (2x4GB)
| Read | Write | Copy | Latency |
| 7616MB/s | 7874MB/s | 9155MB/s | 98.2ns |
Thermal Control
Sensor Temperatures
| CPU | GPU | HDD | Mainboard | |
| Idle | 47c | 50c | N/A | 50c |
| Full | 87c | 82c | N/A | 90c |
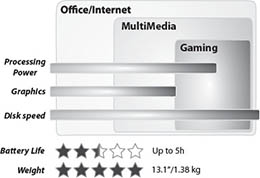
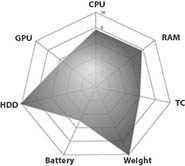
Toshiba Satellite P500
CPU
Intel i7-720QM 1.6GHz (Turbo boost to 2.8GHz) 6M, 8 Threads
| Pifast 10M Time (Single Core) | wPrime 32M Time (Multi Core) | Cinebench R10 Rendering (Multi Core) |
| 26.32s | 15.521s | 9406 |
| (Lower is better) | (Lower is better) | (Higher is better) |
HDD
Toshiba MK5055GSX 500GB
| File Benchmark | File Benchmark | Random Access 4K |
| Maximum Read Speed | Maximum Write Speed | 52 IOPS |
| 68MB/s | 65MB/s | 0.205MB/s |
Graphics
nVidia GeForce GT330M
| 3D Mark 06 Score | Sub Score SM2.0 | Sub Score HDR/SM3.0 | Sub Score CPU |
| 7179 | 2921 | 2818 | 2880 |
| (Higher is better) |
Memory
8GB DDR3 1333MHz (4x2GB)
| Read | Write | Copy | Latency |
| 13519MB/s | 11540MB/s | 11667MB/s | 56.9ns |
Thermal Control
Sensor Temperatures
| CPU | GPU | HDD | Mainboard | |
| Idle | 42c | 34c | 29c | N/A |
| Full | 74c | 54c | 31c | N/A |
Highlights
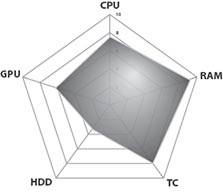
Toshiba Satellite Pro L500 (Super Special)
CPU
Intel Pentium Dual Core T4400 2.2GHz, 1MB, 2 Threads
| Pifast 10M Time (Single Core) | wPrime 32M Time (Multi Core) | Cinebench R10 Rendering (Multi Core) |
| 35.44s | 35.896s | 4025 |
| (Lower is better) | (Lower is better) | (Higher is better) |
HDD
Toshiba MK5055GSXN 500GB
| File Benchmark | File Benchmark | Random Access 4K |
| Maximum Read Speed | Maximum Write Speed | 53 IOPS |
| 58MB/s | 59MB/s | 0.209MB/s |
Graphics
Intel Graphics Media Accelerator 4500MHD
| 3D Mark 06 Score | Sub Score SM2.0 | Sub Score HDR/SM3.0 | Sub Score CPU |
| 1001 | 311 | 393 | 1816 |
| (Higher is better) |
Memory
4GB DDR3 800MHz (2x2GB)
| Read | Write | Copy | Latency |
| 5634MB/s | 4229MB/s | 4476MB/s | 82.7ns |
Thermal Control
Sensor Temperatures
| CPU | GPU | HDD | Mainboard | |
| Idle | 39c | N/A | 28c | N/A |
| Full | 65c | N/A | 29c | N/A |
Highlights
Very good thermal control

Toshiba Satellite Pro T110 (PST1BA-009007)
CPU
Intel Celeron ULV-743 1.3GHz
| Pifast 10M Time (Single Core) | wPrime 32M Time (Multi Core) | Cinebench R10 Rendering (Multi Core) |
| 58.50s | 123.66s | 1340 |
| (Lower is better) | (Lower is better) | (Higher is better) |
HDD
Toshiba MK2555GSX 250GB
| File Benchmark | File Benchmark | Random Access 4K |
| Maximum Read Speed | Maximum Write Speed | 51 IOPS |
| 66MB/s | 66MB/s | 0.208MB/s |
Graphics
Intel Graphics Media Accelerator
| 3D Mark 06 Score | Sub Score SM2.0 | Sub Score HDR/SM3.0 | Sub Score CPU |
| 628 | 204 | 253 | 578 |
| (Higher is better) |
Memory
2GB DDR3
| Read | Write | Copy | Latency |
| 5251MB/s | 4065MB/s | 3867MB/s | 95.4ns |
Thermal Control
Sensor Temperatures
| CPU | GPU | HDD | Mainboard | |
| Idle | 40c | N/A | 29c | N/A |
| Full | 58c | N/A | 31c | N/A |

Toshiba Satellite Pro T130 (PST3BA-00N00U)
CPU
Intel Core 2 Duo ULV SU7300 1.3GHz
| Pifast 10M Time (Single Core) | wPrime 32M Time (Multi Core) | Cinebench R10 Rendering (Multi Core) |
| 55.57s | 60.56s | 2921 |
| (Lower is better) | (Lower is better) | (Higher is better) |
HDD
Toshiba MK2555GSX 250GB
| File Benchmark | File Benchmark | Random Access 4K |
| Maximum Read Speed | Maximum Write Speed | 50 IOPS |
| 65MB/s | 62MB/s | 0.196MB/s |
Graphics
Intel Graphics Media Accelerator
| 3D Mark 06 Score | Sub Score SM2.0 | Sub Score HDR/SM3.0 | Sub Score CPU |
| 557 | 174 | 216 | 1150 |
| (Higher is better) |
Memory
2GB DDR3 800MHz
| Read | Write | Copy | Latency |
| 5107MB/s | 4072MB/s | 3800MB/s | 106.5ns |
Thermal Control
Sensor Temperatures
| CPU | GPU | HDD | Mainboard | |
| Idle | 45c | N/A | 28c | N/A |
| Full | 61c | N/A | 31c | N/A |
Highlights
Good thermal control
| Products | My Account | Info & Support | Contact Us |
Copyright © 2025 mobile laptops & notebooks. All Rights Reserved. Pictures are for demonstration purposes only.
MLN Sitemap
MLN Sitemap


